An exciting new feature was added! The Stock Screener is a tool where you can search for stocks that match certain criteria. You can also apply indicators to the Screener to further analyze which ones present an opportunity. And now, we made it even easier to spot potential profits by adding ratings to the indicators.
Basically, when a certain condition is met for an indicator, it typically means it’s a good time to buy or sell. We made those signs clearly visible and below is a list of when they appear.
Here is what they mean:
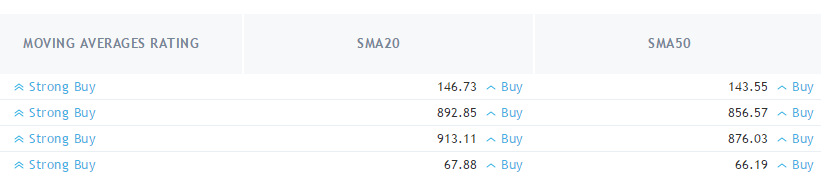
- Simple & Exponential Moving Averages
∧ Buy – indicator values < price
∨ Sell– indicator values > price
- Relative Strength Index
∧ Buy – indicator < lines that represent oversold conditions and indicator values are rising
∨ Sell – indicator > lines that represent overbought conditions and indicator values are falling
- Stochastic
∧ Buy – main line < lower band (20) and main line crosses the signal line from bottom-up
∨ Sell – main line > upper band (80) and main line crosses the signal line from above-down
- Commodity Channel Index
∧ Buy – indicator < oversold level (-100) and reversed upwards
∨ Sell – indicator > overbought level (100) and reversed downwards
- Average Directional Index
∧ Buy – indicator > 20 and +DI line crossed -DI line from bottom-up
∨ Sell – indicator > 20 and +DI line crossed -DI line from above-down
- Awesome Oscillator
∧ Buy – saucer and values are greater than 0 or zero line cross from bottom-up
∨ Sell – saucer and values are lower than 0 or zero line cross from above-down
- Momentum
∧ Buy – indicator values are rising
∨ Sell – indicator values are falling
- MACD
∧ Buy – main line values > signal line values
∨ Sell – main line values < signal line values
- Bollinger Bands
∧ Buy – price < lower band
∨ Sell – price > upper band
- Parabolic SAR
∧ Buy – indicator values < opening price
∨ Sell – indicator values > opening price
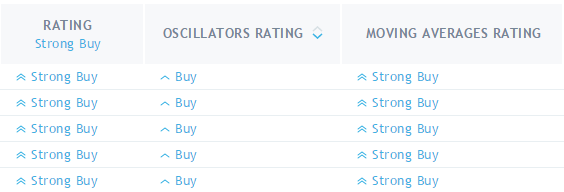
We’ve also added columns with general ratings. For example the “Rating” column will show you combined ratings for all of the indicators mentioned above. You can also add your own filters to this column.
There’s also a context menu now for the column headers. You can:
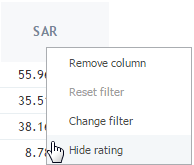
Delete the column
Reset or edit the filter
Show or hide rating
Show or hide the description for the “Company” column