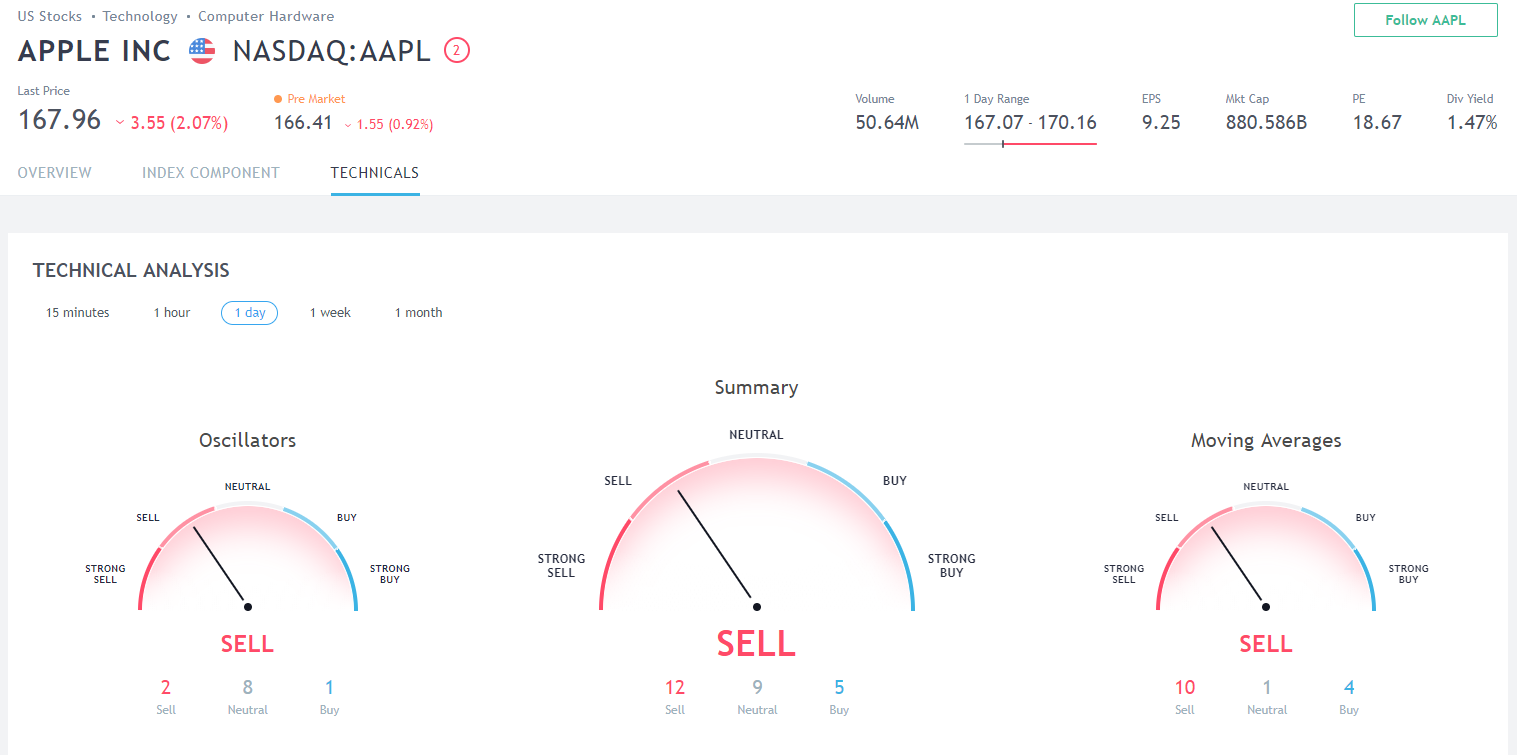
Good news, we’ve just made our platform even more powerful by adding a new technical analysis tool. You are now able to see ratings for 3 groups of indicators: Oscillators, Moving Averages and a Summary based on all ratings. You’ll see the total number of ratings used at the bottom of each gauge. This is a great way to see key technical indicators on a single page.
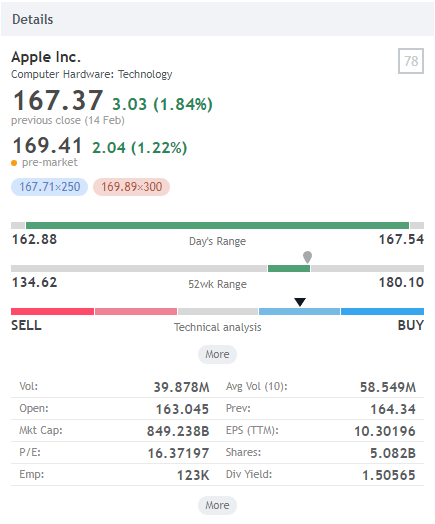
 You can also open the technical analysis dashboard directly from the Details window of the web platform. It’s located right below the 52-week range on the right hand side of the platform.
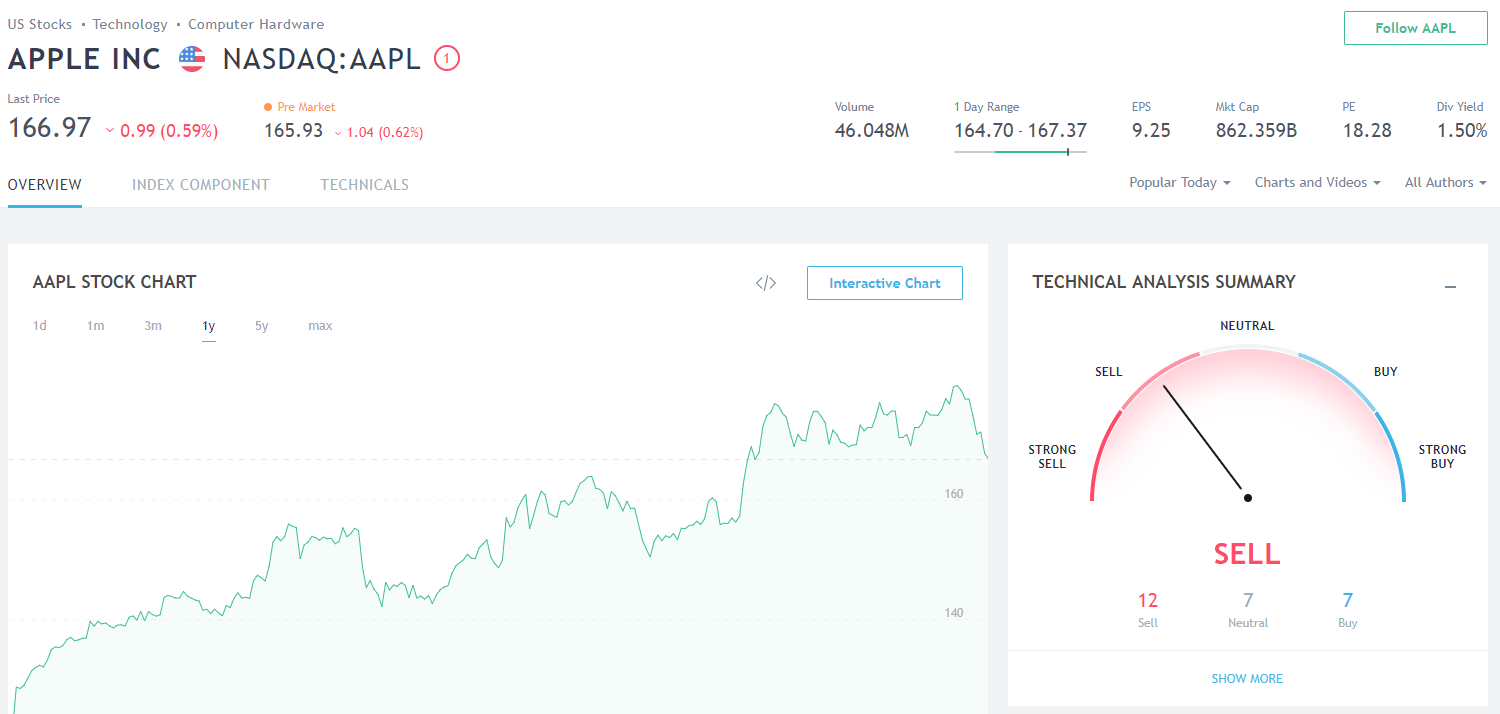
The Overview tab as well as the Details window shows the technical analysis summary based on a daily timeframe by default. Click show more to see more timeframes in a separate tab.
Technical analysis ratings that our gauges display are based on indicator ratings from our screener. Once a certain condition is met for an indicator it typically means that it’s a good time to buy/sell.
Important: TradingView does not advise anyone to (blindly) buy or sell any financial instrument based on the Buy/Sell ratings. It merely indicates that certain indicator conditions are met and can help users spot potential trades if it fits their strategy. Buy/Sell ratings should not be considered as trading recommendations.
Feel free to get in touch with us if you have any questions or suggestions for improvement. Click the Report button to send your message. As always, your feedback is highly appreciated.