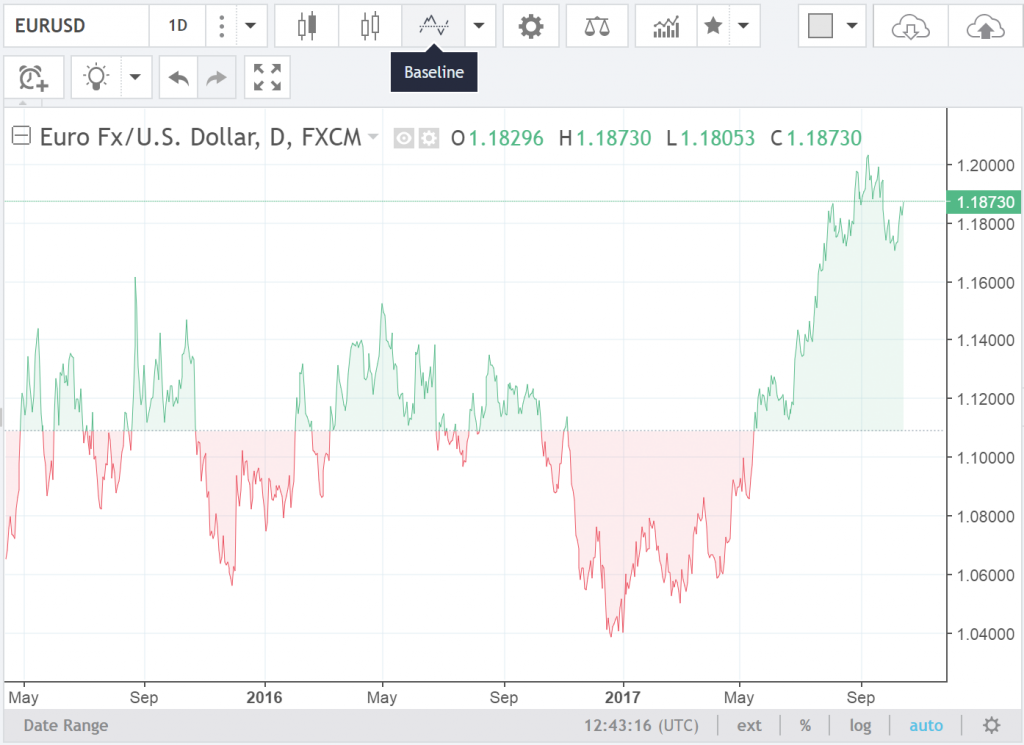
The Baseline chart shows price movements relative to a baseline that you choose. This can be very useful for analyzing price fluctuations.
Click the Chart Style button in the top panel and select Baseline in the dropdown menu.
You can change the baseline level dragging it up and down. The Chart Properties dialog lets you finetune extended settings:
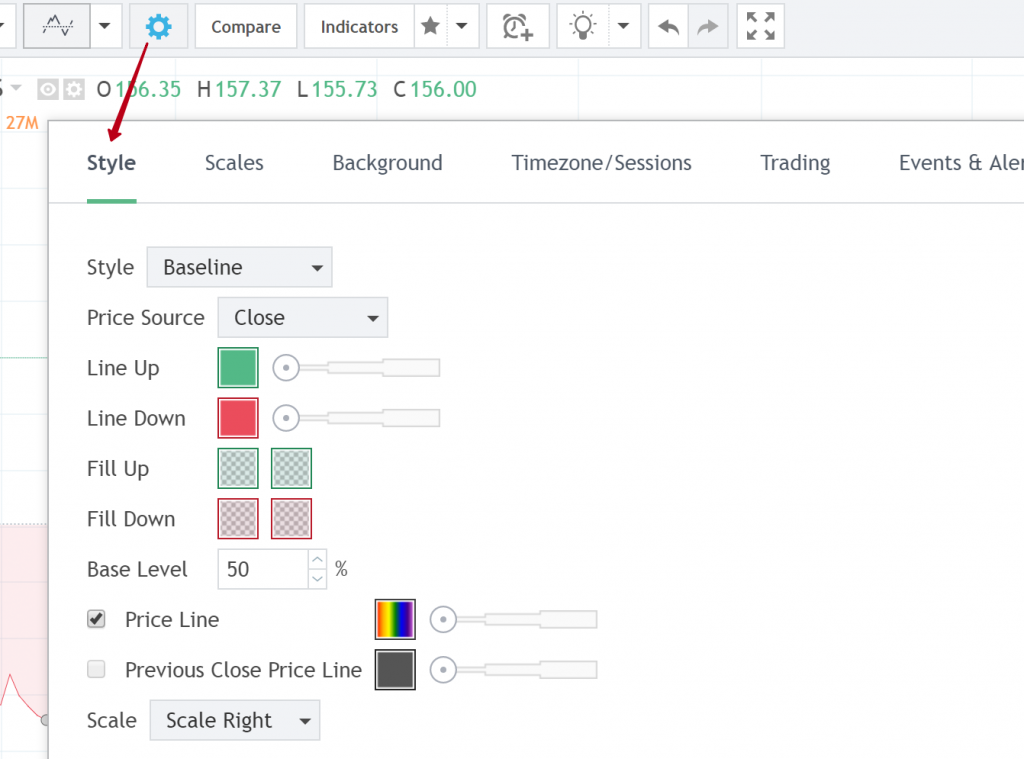
Price Source – the time bar values that are displayed on the chart. The following options are possible: Close, Open, High, Low, (High+Low)/2, (High+Low+Close)/3, (Open+High+Low+Close)/4.
Line Up – color and thickness of the line that displays the upper border.
Line Down – color and thickness of the line that displays the lower border.
Fill up – adjust the fill color of the top area.
Fill Down – adjust the fill color of the bottom area.
Base Level – the value of the line level calculated as a percentage of pane height:
- The value is set to 50% by default.
- 0 % – equals the lower border of the pane, 100 % – equals the upper border.
- The level value is saved to the chart.