Price changes are not always easy to spot especially when markets are volatile. We wanted to make it easier for you to see those changes and added the option to display bar change values in the legend. This value shows the difference between the open price and close price of the current bar.
Here is how it is calculated.
- The absolute value (rounded to the same decimal place that is shown on the price axis)
Change = Close price – Previous Close price
- Percentage change (rounded to 2nd decimal place)
% change = ((Close price – Previous Close price)/Previous Close price) * 100
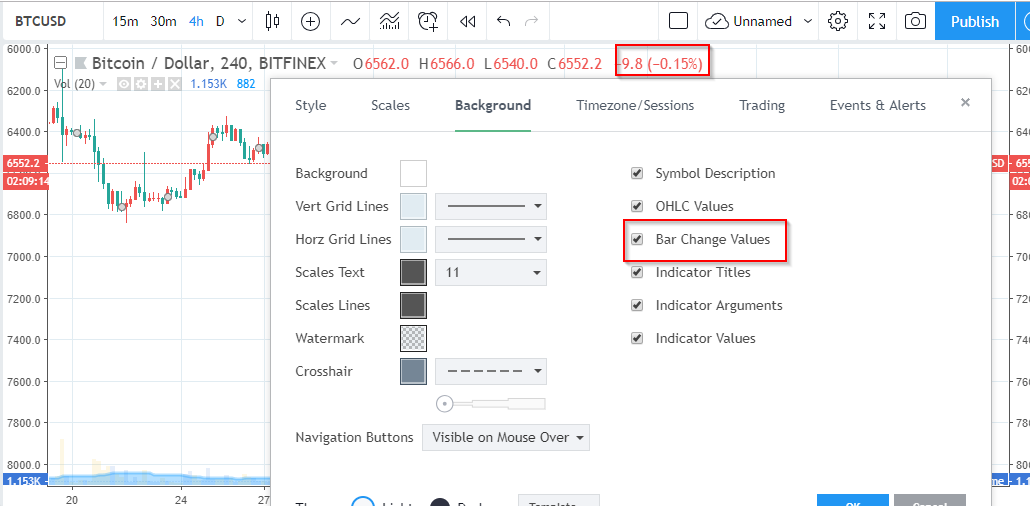
You can always disable bar change values in your chart properties: