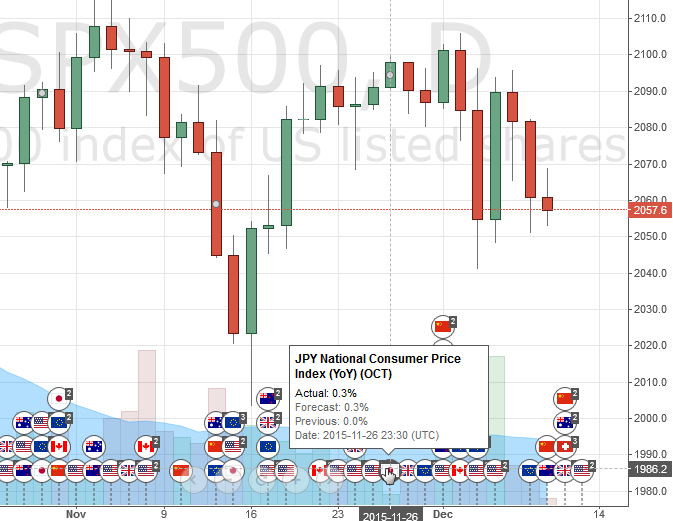
We have added major economic events right to your charts:
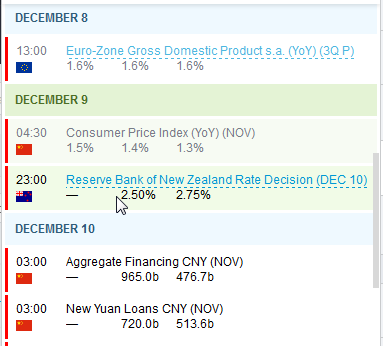
You can find a calendar of events on the right panel:

Depending on the color indicator, events can be:
- Red – very important
- Yellow – important
They also are highlighted according to the following logic:
- Light green – today events
- Dark green – next event
It helps you to see a coming event in the list:
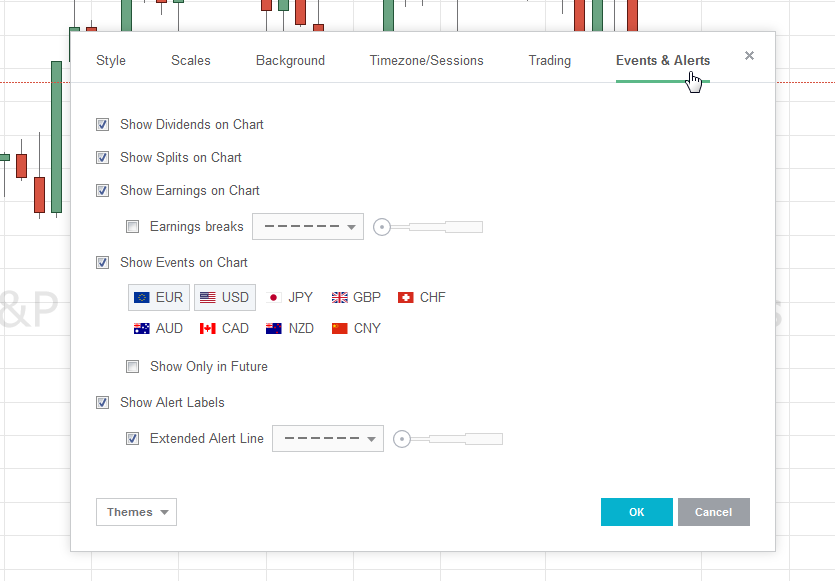
You can configure the calendar to see only the info you need and hide everything else.

Very important events are shown on your charts. You can configure this on Events & Alerts tab in chart properties. You can set chart either to show all events, or only coming events for your analysis.
Stay tuned for more improvements!