Here are the main features that we added recently:
INTRADAY SPREAD CHARTS
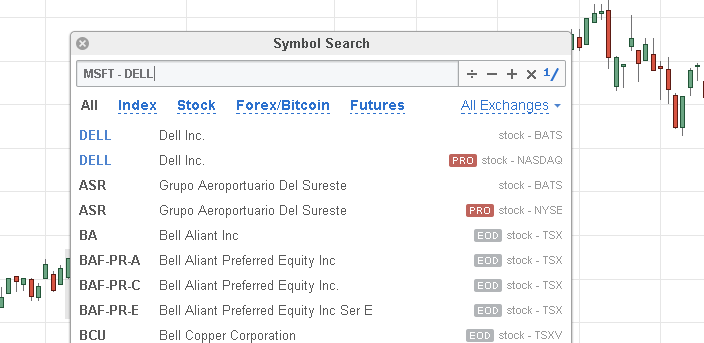
We made something that no one has made in online charts to date (as far as we know). Now you can build any spread chart by simply typing your formula in the Symbol Edit field using parentheses or multiple operators (+-*/). In addition to using multiple symbols in a spread, you can also use numerical constants such as MSFT + 50.
Spreads for intraday charts are calculated by taking the Open, High, Low, and Close of each 1-minute bar and then recompiled into the selected interval. This approach is the only one that results in correct spread charts. We handle all necessary calculations on our servers and display the finished spread chart in your browser. Welcome to the new era of online charting!
To enter a spread in TradingView, enter the first symbol and follow it with a space; next enter an operator (-) for subtraction (+) for addition (*) for multiplication and (/) for division; then another space and then the next symbol.
Here are few examples:
1/USDCHF or chart inversions helpful when you want to chart the correlation between the EURUSD and the USDCHF for example. In this case you want to flip the USDCHF chart. Or VIX and S&P500 comparison: if flip one of them, it will be visually.
AAPL/EURUSD or AAPL*USDRUB allows you to the the stock price in other currency
AAPL/XAUUSD – Apple vs Gold
BATS:AAPL-NASDAQ:AAPL arbitrage between BATS and NASDAQ exchanges
BTCUSD-BTCEUR*EURUSD bitcoin arbitrage
FEU/XLB – pair trading example
S&P AND RUSSELL INDEXES ADDED
Standard and Poor’s 500 (SPX) is one of the most popular indexes in the world for traders to watch. The S&P 500 index includes 500 leading companies and captures approximately 80% coverage of available market capitalization. Standard and Poor’s also has a list of other useful indexes that you can research, i.e. S&P Midcap 400 (IDX). S&P 100 (OEX), and S&P Europe 350 (SEUD). There are literally hundreds of these, just search for “SnP” on your chart, and choose “Index” tab.
The broad-market U.S. index is the Russell 3000 Index (RUA), which is divided into several sub-indexes, including the small-cap Russell 2000 Index (IUX). The Russell Indexes are a family of global equity indices that allow investors to track the performance of distinct market segments worldwide. Many investors use mutual funds or exchange-traded funds based on the Russell Indexes as a way of gaining exposure to certain portions of the U.S. stock market. Additionally, many investment managers use the Russell Indexes as benchmarks to measure their own performance. There are literally hundreds of these, just search for “RUSSELL” on your chart, and choose “Index” tab.
BITCOIN
Bitcoin is an experimental, decentralized digital currency that enables instant payments to anyone, anywhere in the world. Bitcoin uses peer-to-peer technology to operate with no central authority: managing transactions and issuing money are carried out collectively by the network.
Bitcoins have an exchange rate with other currencies, i.e. Bitcoin/US Dollar (BTCUSD) and Bitcoin/Euro (BTCEUR), which you can now track in real-time on TradingView!
We currently support pairs for bitcoin with the following currencies – USD, AUD, CAD, CHF, CNY, DKK, EUR, GBP, HKD, JPY, NZD, PLN, RUB, SEK, SGD, THB, NOK, CZK. Just search for “Bitcoin” on your chart, and choose the “Bitcoin” tab.
NEW INDICATORS
Awesome Oscillator
Choppiness Index
Connor’s RSI
Double EMA
Know Sure Thing
Relative Vigor Index
Relative Volatility Index
Triple EMA
Price Volume Trend
VWMA
VWAP was changed
AlgoviewEssential – NEW ADDON PACKAGE
The Algoview Essential package contains classical and widely used trading indicators. The majority of these indicators are “price action” oriented, with a candlestick patterns finder, a powerful range patterns indicator (to easily find NR4/NR7 patterns for example), and the popular ThrustBars. The other indicators are also very popular, with the MACDBB which helps to get a better picture than a simple MACD, and the famous SuperTrend, which is an excellent tool to manage trailing stops. Six additional indicators will be added later in this package. Trading is not easy, and nothing is black or white, but with these tools you will have a clearer view of what’s happening on a market, it’s up to you to use it in your favor! Visit PRO page to learn more.